
In Excel, monthly purchase data is often stored in a messy report format.
For example, month names such as Jan, Feb, and Mar may appear as section headers, while supplier and purchase information are listed underneath.
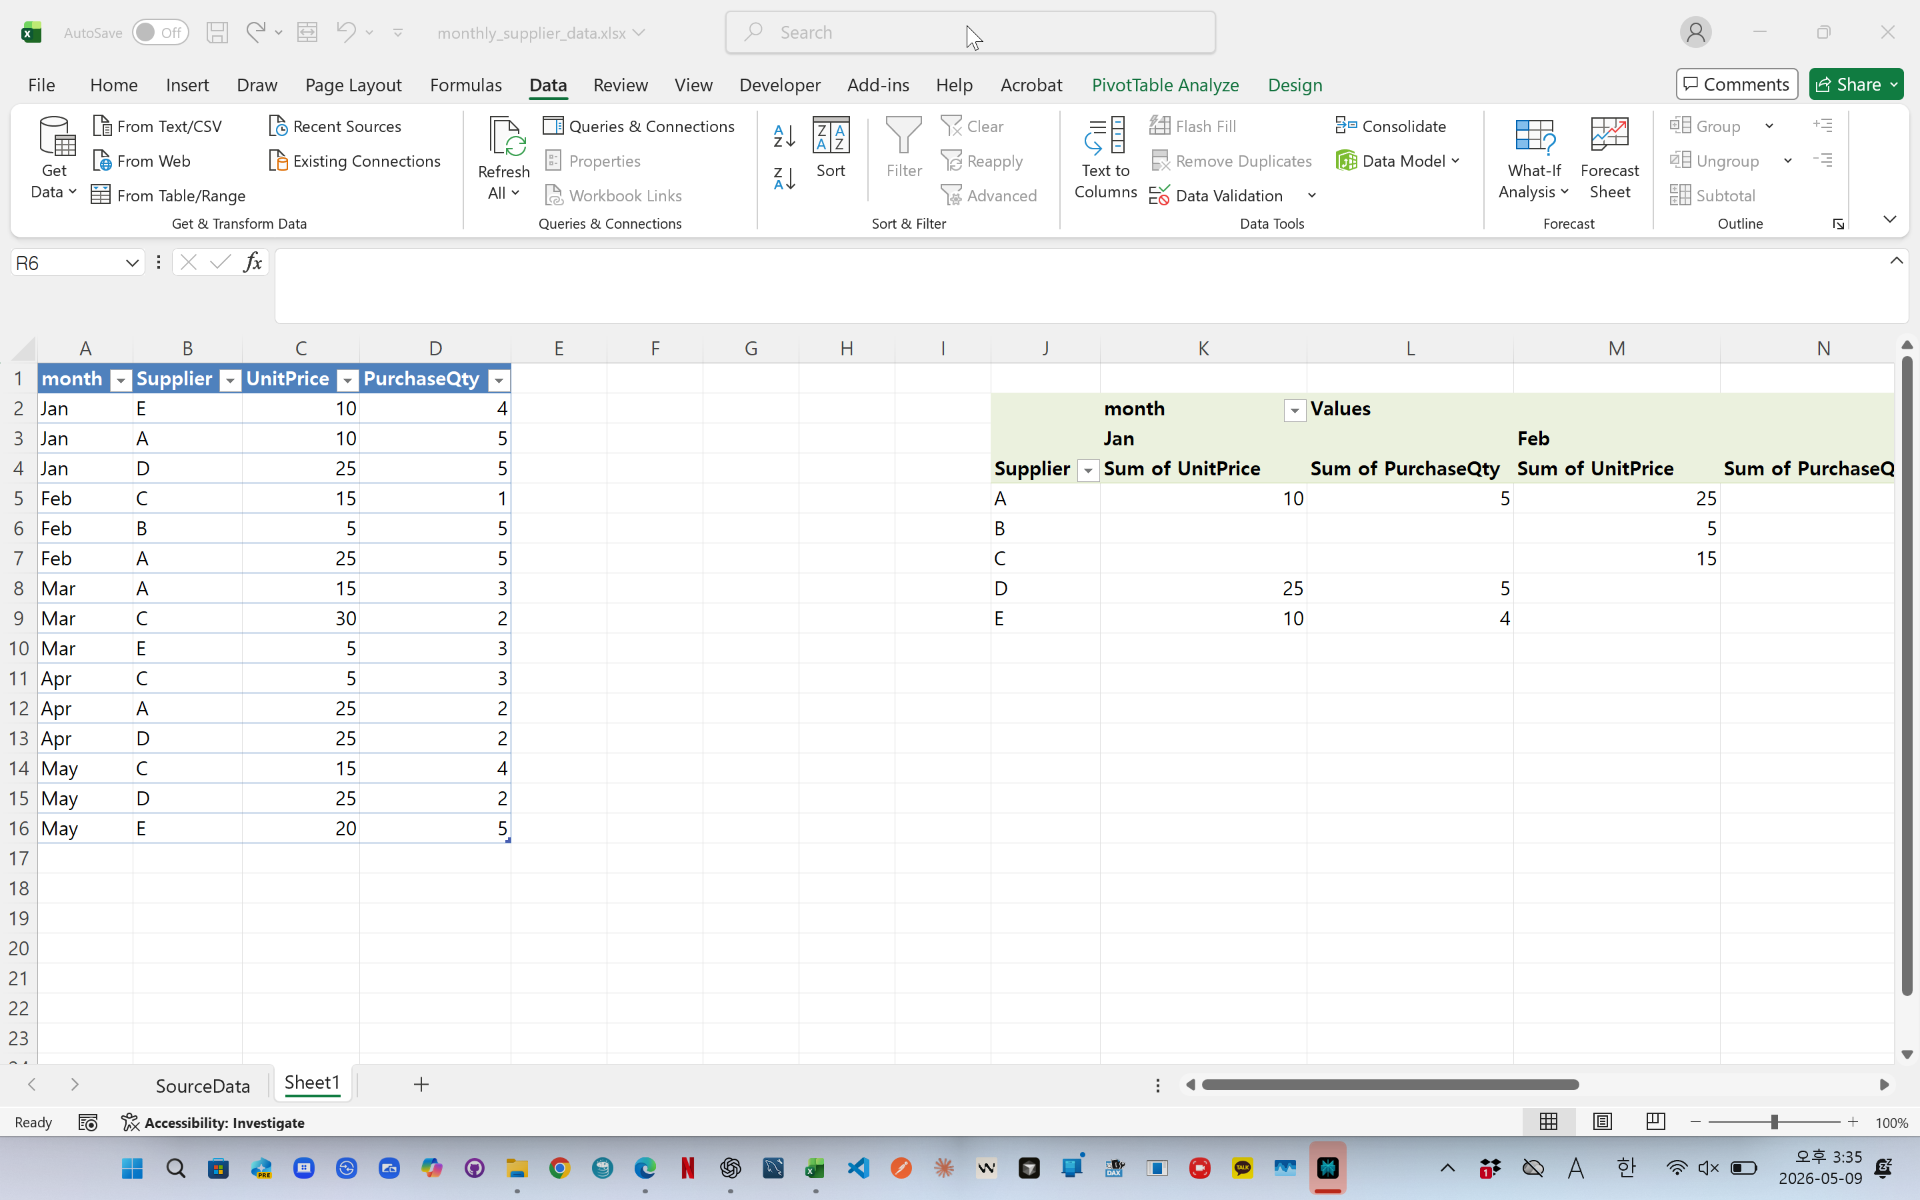
This structure is difficult to analyze directly with Pivot Tables.
In this example, Power Query automatically cleans the report by:
- Detecting month header rows
- Filling month values downward
- Removing unnecessary rows
- Renaming columns
- Creating a clean table structure
After the transformation, the data can be loaded into Excel and analyzed easily using a Pivot Table.
This method is very useful for accounting reports, supplier management, and monthly purchase analysis.
videolink - https://youtu.be/CL2rSTBv1WM
Download the sample file below.
You can download the zip file in [Download] page
The file name is 44-1.pivottable_monthly_report.zip
Use the English M code provided for your dataset.
You may need to manipulate the M code under your circumstance. You consider this point and use M code
below txt file is detailed-explanation. You use M code in reference with this explanation.
---------------------------------------------------------
Need a custom automation for your Excel workflow?
I can build a tailored solution based on your data.
✔ Used in real-world business automation
✔ Saves hours of manual work
minbedata@gmail.com
You can pay via PayPal.
You don't worry about conversing with me.
My Major is an English literature, so I can speak English fluently and read, listening, writing proficiently
korean version web address (한국버전) is
<a href="https://blog.naver.com/minbe-data" target="_blank">네이버 블로그 바로가기</a>