
Many Excel reports store product sales data in separate sections across a worksheet.
For example, each product may have its own Buyer, Quantity, and Amount columns.
While this layout is easy to read, it is difficult to analyze and summarize.
In this example, Power Query automatically:
- Extracts multiple product sections
- Standardizes column names
- Combines all product tables
- Removes blank records
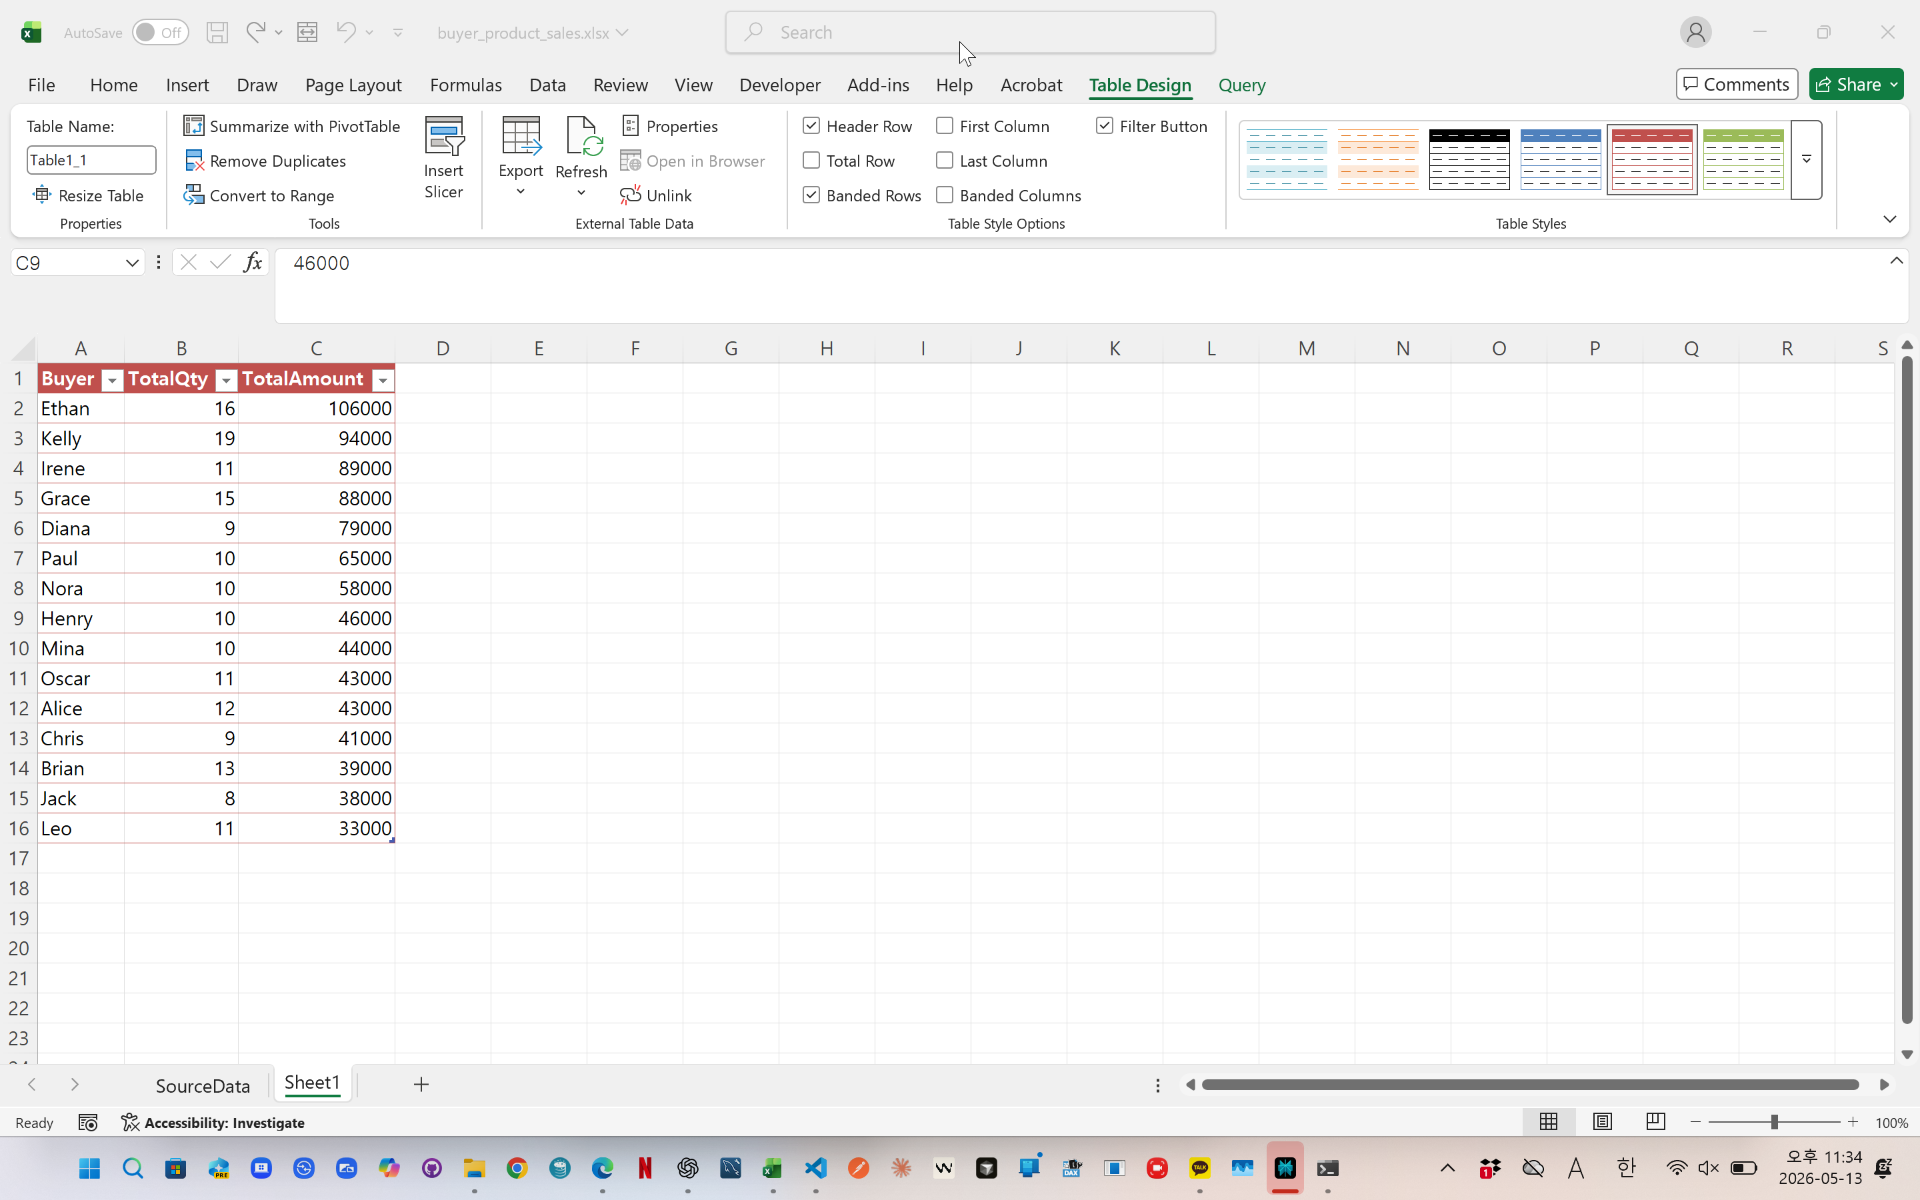
- Calculates total quantity by buyer
- Calculates total sales amount by buyer
- Creates a buyer ranking report
The final result provides a clean summary table sorted by total sales amount.
This method is useful for sales analysis, customer rankings, purchase tracking, and Excel reporting automation.

videolink - https://youtu.be/wQFqvHmKjUI
Download the sample file below.
You can download the zip file in [Download] page
The file name is 45.buyer_sales_summary_pq.zip.
Use the English M code provided for your dataset.
You may need to manipulate the M code under your circumstance. You consider this point and use M code
below txt file is detailed-explanation. You use M code in reference with this explanation.
---------------------------------------------------------
Need a custom automation for your Excel workflow?
I can build a tailored solution based on your data.
✔ Used in real-world business automation
✔ Saves hours of manual work
minbedata@gmail.com
You can pay via PayPal.
You don't worry about conversing with me.
My Major is an English literature, so I can speak English fluently and read, listening, writing proficiently
korean version web address (한국버전) is
<a href="https://blog.naver.com/minbe-data" target="_blank">네이버 블로그 바로가기</a>