Powerquery automation 44

How to Merge Multiple Mapping Tables Automatically with Power Query

Managing sales data often requires combining multiple lookup tables before analysis. In this example, Power Query automatically merges three different mapping tables into a single sales dataset. The automation process includes: - Loading a sales table - Importing multiple mapping tables from an external Excel file - Matching Sales Manager by Branch and Item - Matching Category and Account by Ite..

How to Combine Multiple Excel Files and Standardize Sales Data with Power Query

Managing sales data from multiple Excel files can be challenging when each file has different column names and formats. In this example, Power Query automatically imports every Excel file from a folder and converts them into a standardized dataset. The automation process includes: - Importing multiple Excel files from a folder - Ignoring hidden and temporary files - Detecting tables or worksheet..

How to Build an Automated Meal Plan and Recipe Report with Power Query and Python

Managing meal plans manually can be time-consuming, especially when ingredient quantities must be adjusted based on the number of people. In this example, Power Query and Python work together to automate the entire process. Power Query automatically: - Merges meal plans with recipe data - Calculates ingredient quantities - Adjusts quantities by person count - Creates a clean meal planning datase..

How to Filter Expense Report Details with Power Query and XLOOKUP

In Excel expense reports, card usage data is often stored in a separate table. When preparing an expense report, we usually need to bring only the transactions that match a selected date and management number. In this example, XLOOKUP is used to bring key report information, while Power Query filters the related card usage records automatically. Power Query checks: - Report Date - Management Num..

How to Calculate Weekday and Holiday Workdays Automatically with Power Query

Tracking employee workdays can be difficult when working hours are recorded across multiple day columns. In many attendance sheets, employees are listed in rows while daily work hours are stored horizontally. In this example, Power Query automatically: - Converts daily work hours into a structured table - Identifies weekdays and holidays - Applies custom workday rules - Counts qualifying weekday..

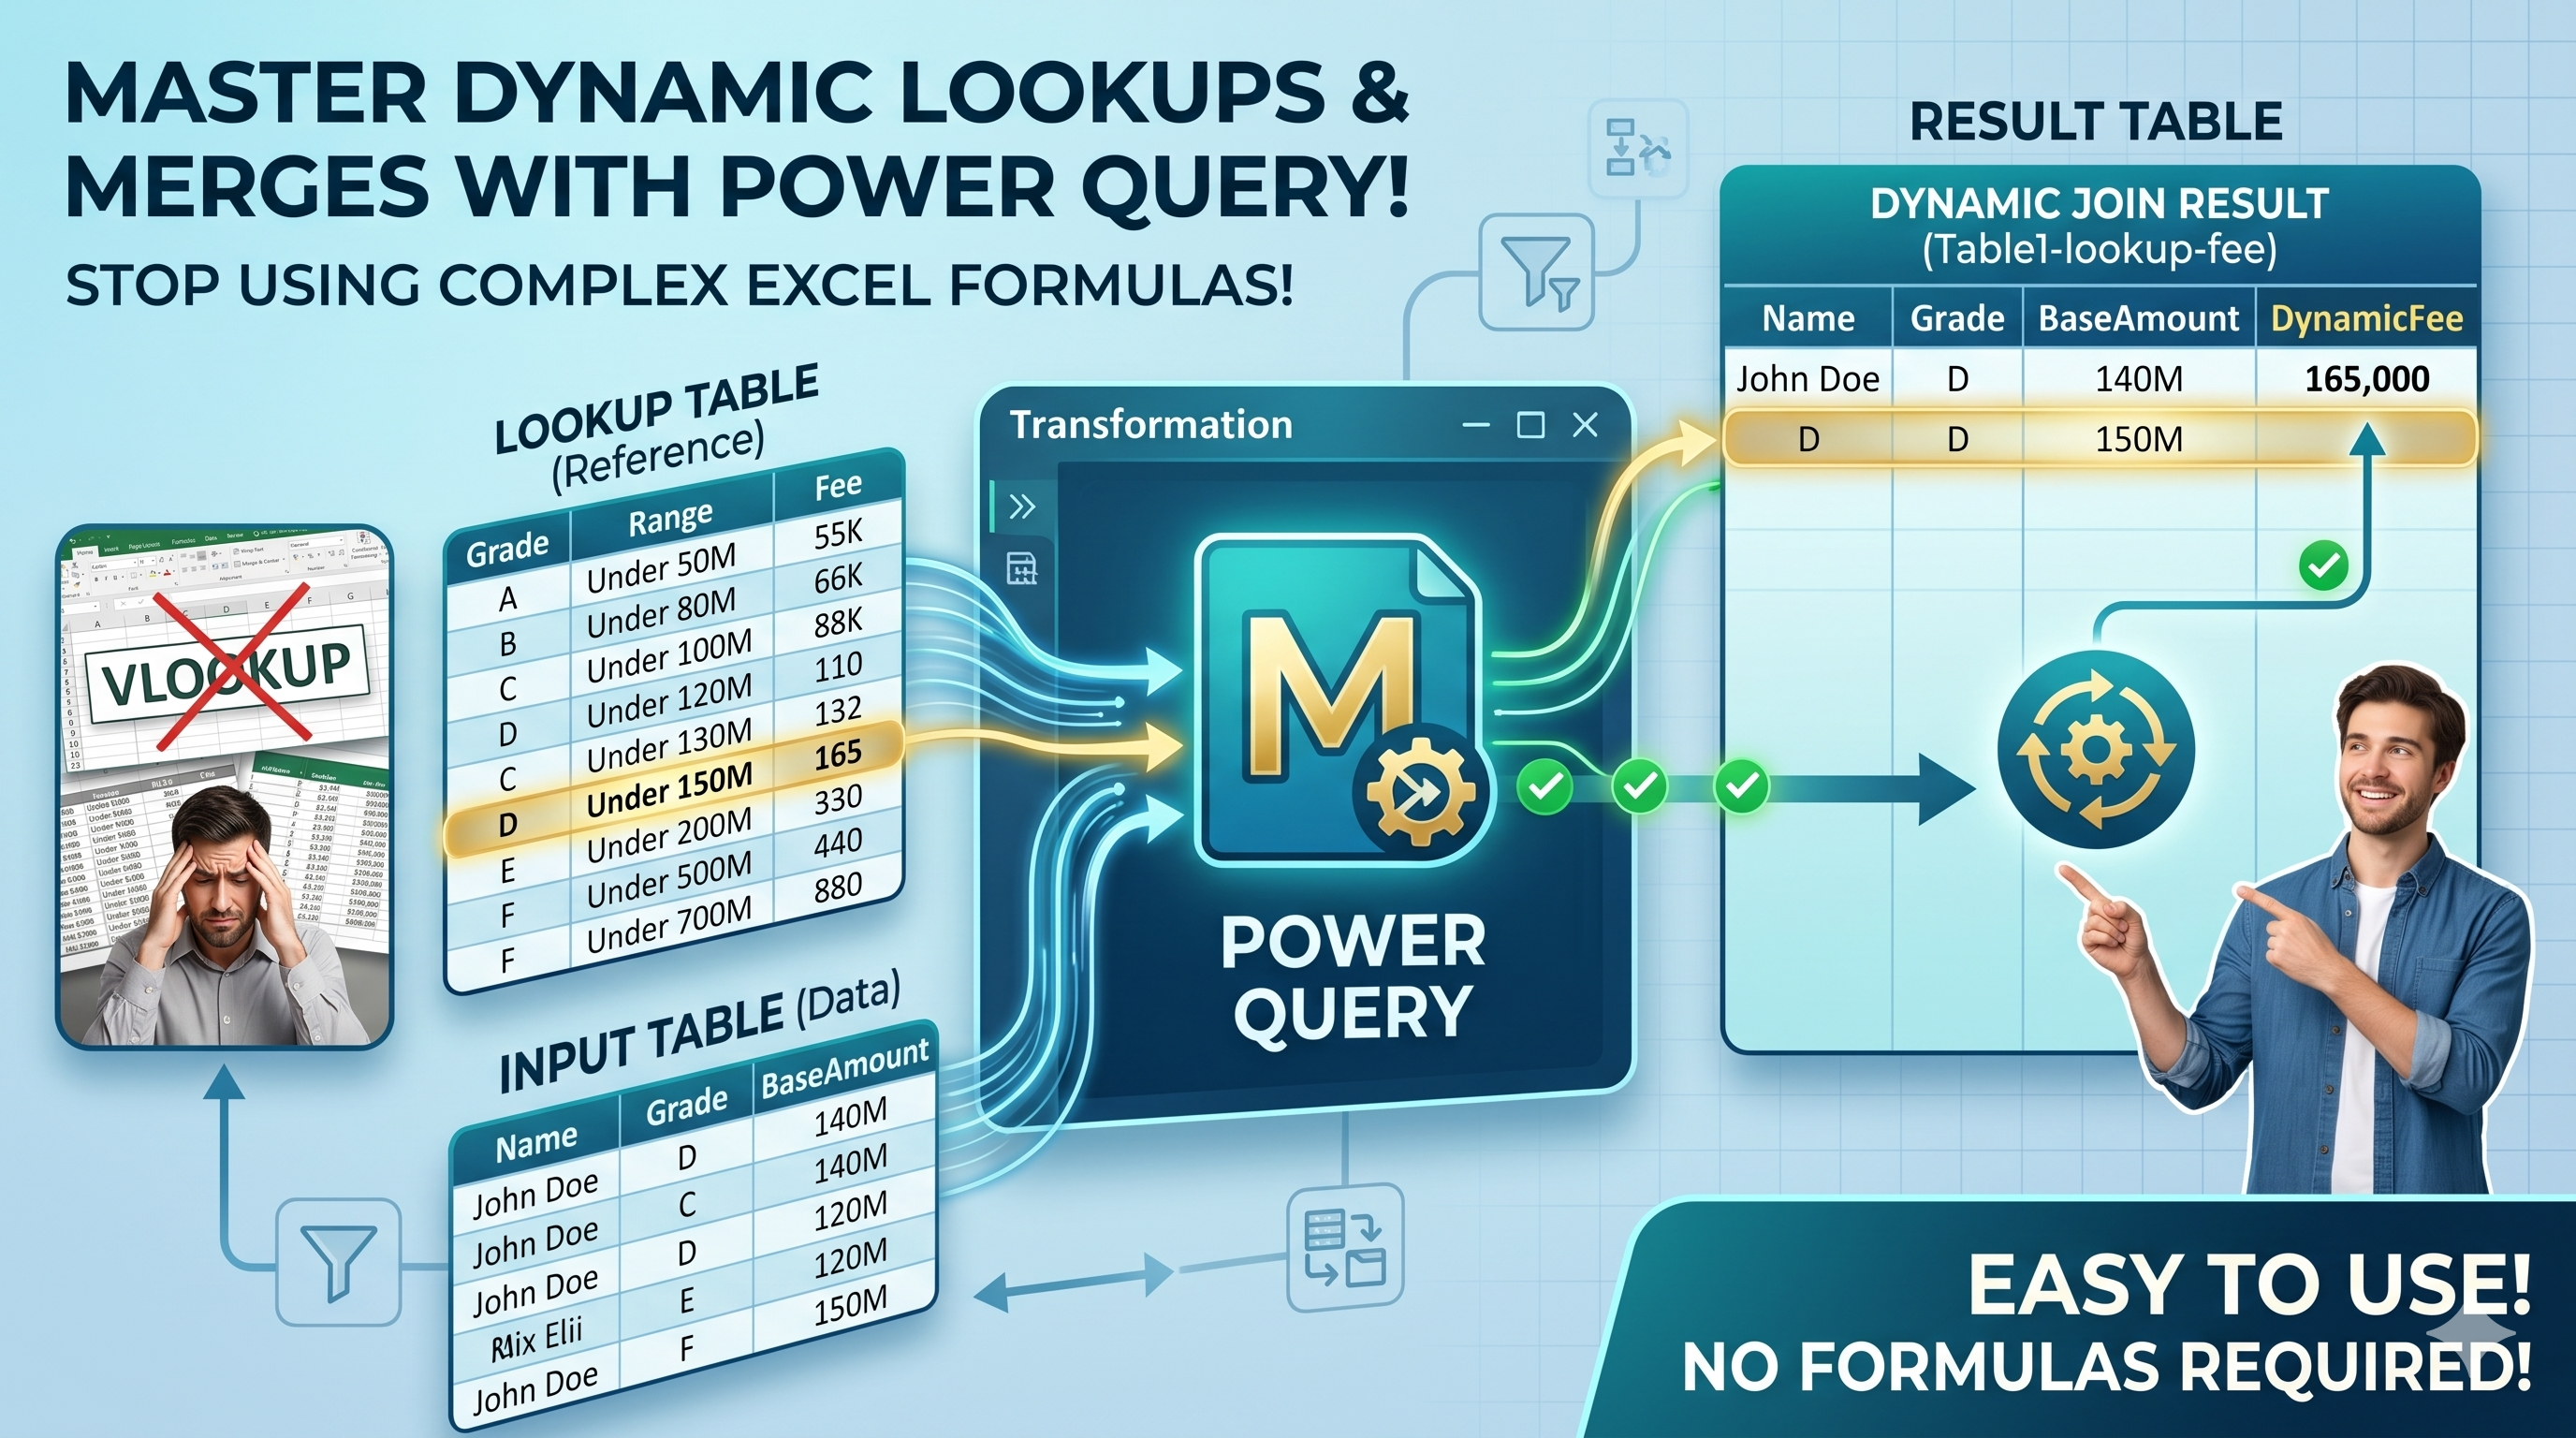
How to Calculate Fees Automatically by Grade and Amount Range with Power Query

Many pricing tables use both grade levels and amount ranges to determine fees. For example, the fee may vary depending on: - Customer Grade - Contract Amount - Loan Amount - Sales Amount - Property Value In this example, Power Query automatically finds the correct fee by comparing the selected Grade and Base Amount against a predefined fee table. The result updates automatically whenever the inp..

How to Consolidate Multiple Product Tables and Create Buyer Rankings with Power Query

Many Excel reports store product sales data in separate sections across a worksheet. For example, each product may have its own Buyer, Quantity, and Amount columns. While this layout is easy to read, it is difficult to analyze and summarize. In this example, Power Query automatically: - Extracts multiple product sections - Standardizes column names - Combines all product tables - Removes blank r..

How to Transform Monthly Excel Reports into a Dynamic Pivot Table with Power Query

Many Excel reports contain monthly sections such as Jan, Feb, and Mar mixed together in a single worksheet. This type of structure is difficult to analyze because the data is not arranged in a proper table format. In this example, Power Query automatically: - Detects month header rows - Fills month values downward - Cleans supplier data - Unpivots the report structure - Combines month and attrib..