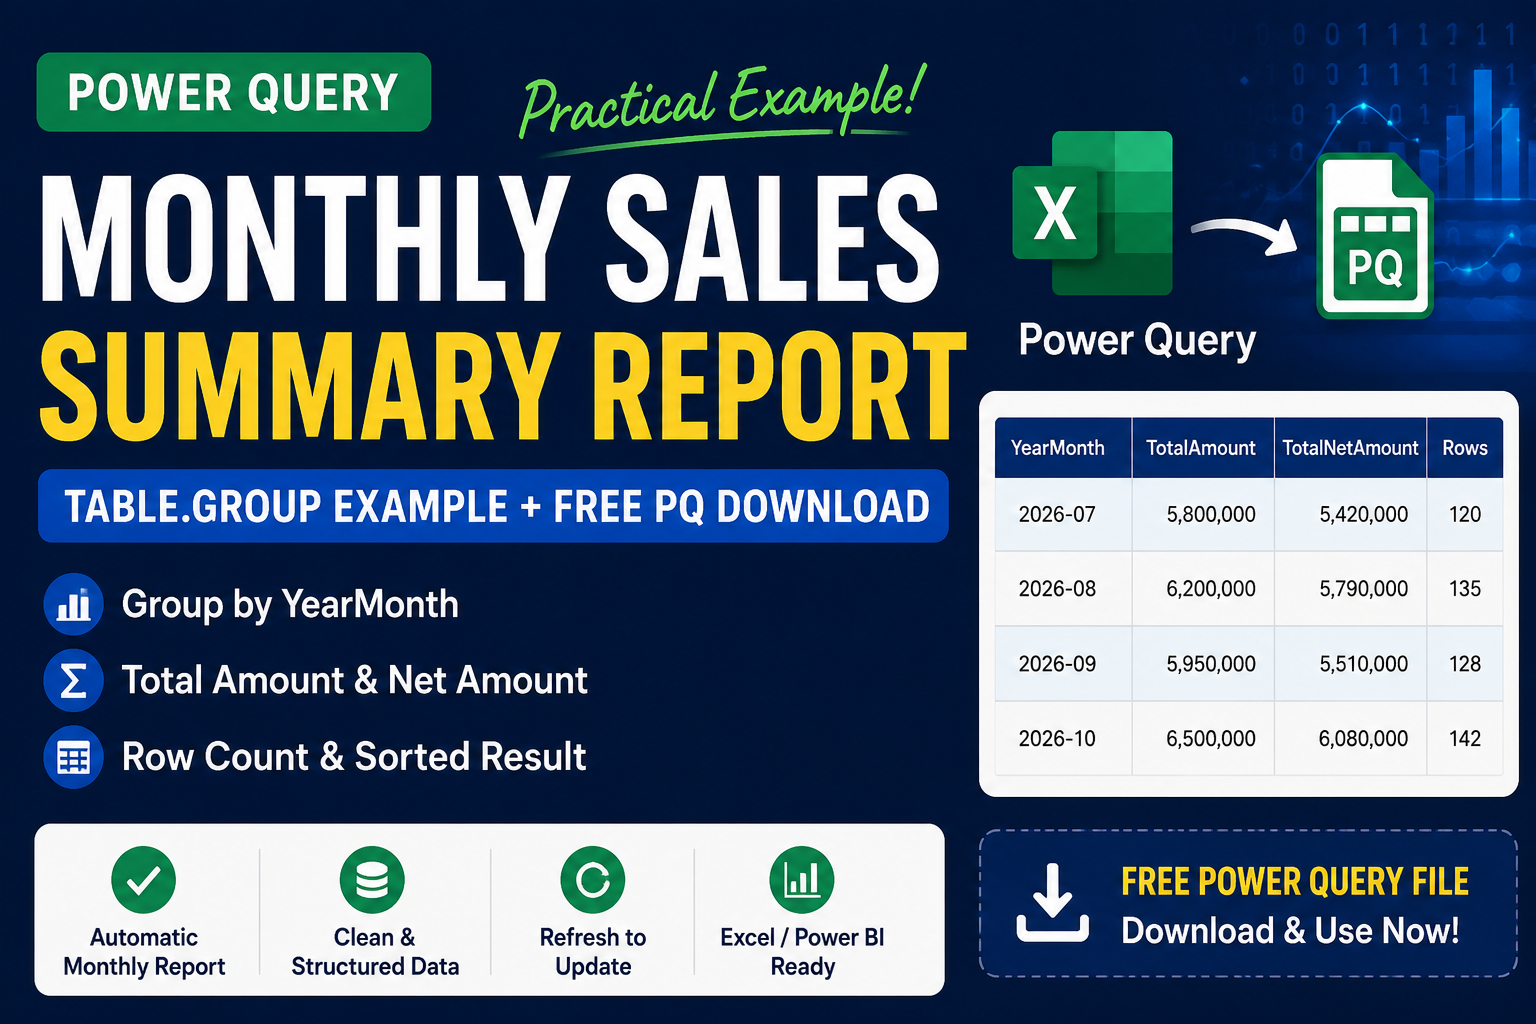
This Power Query example demonstrates how to create a monthly sales summary report using Table.Group.
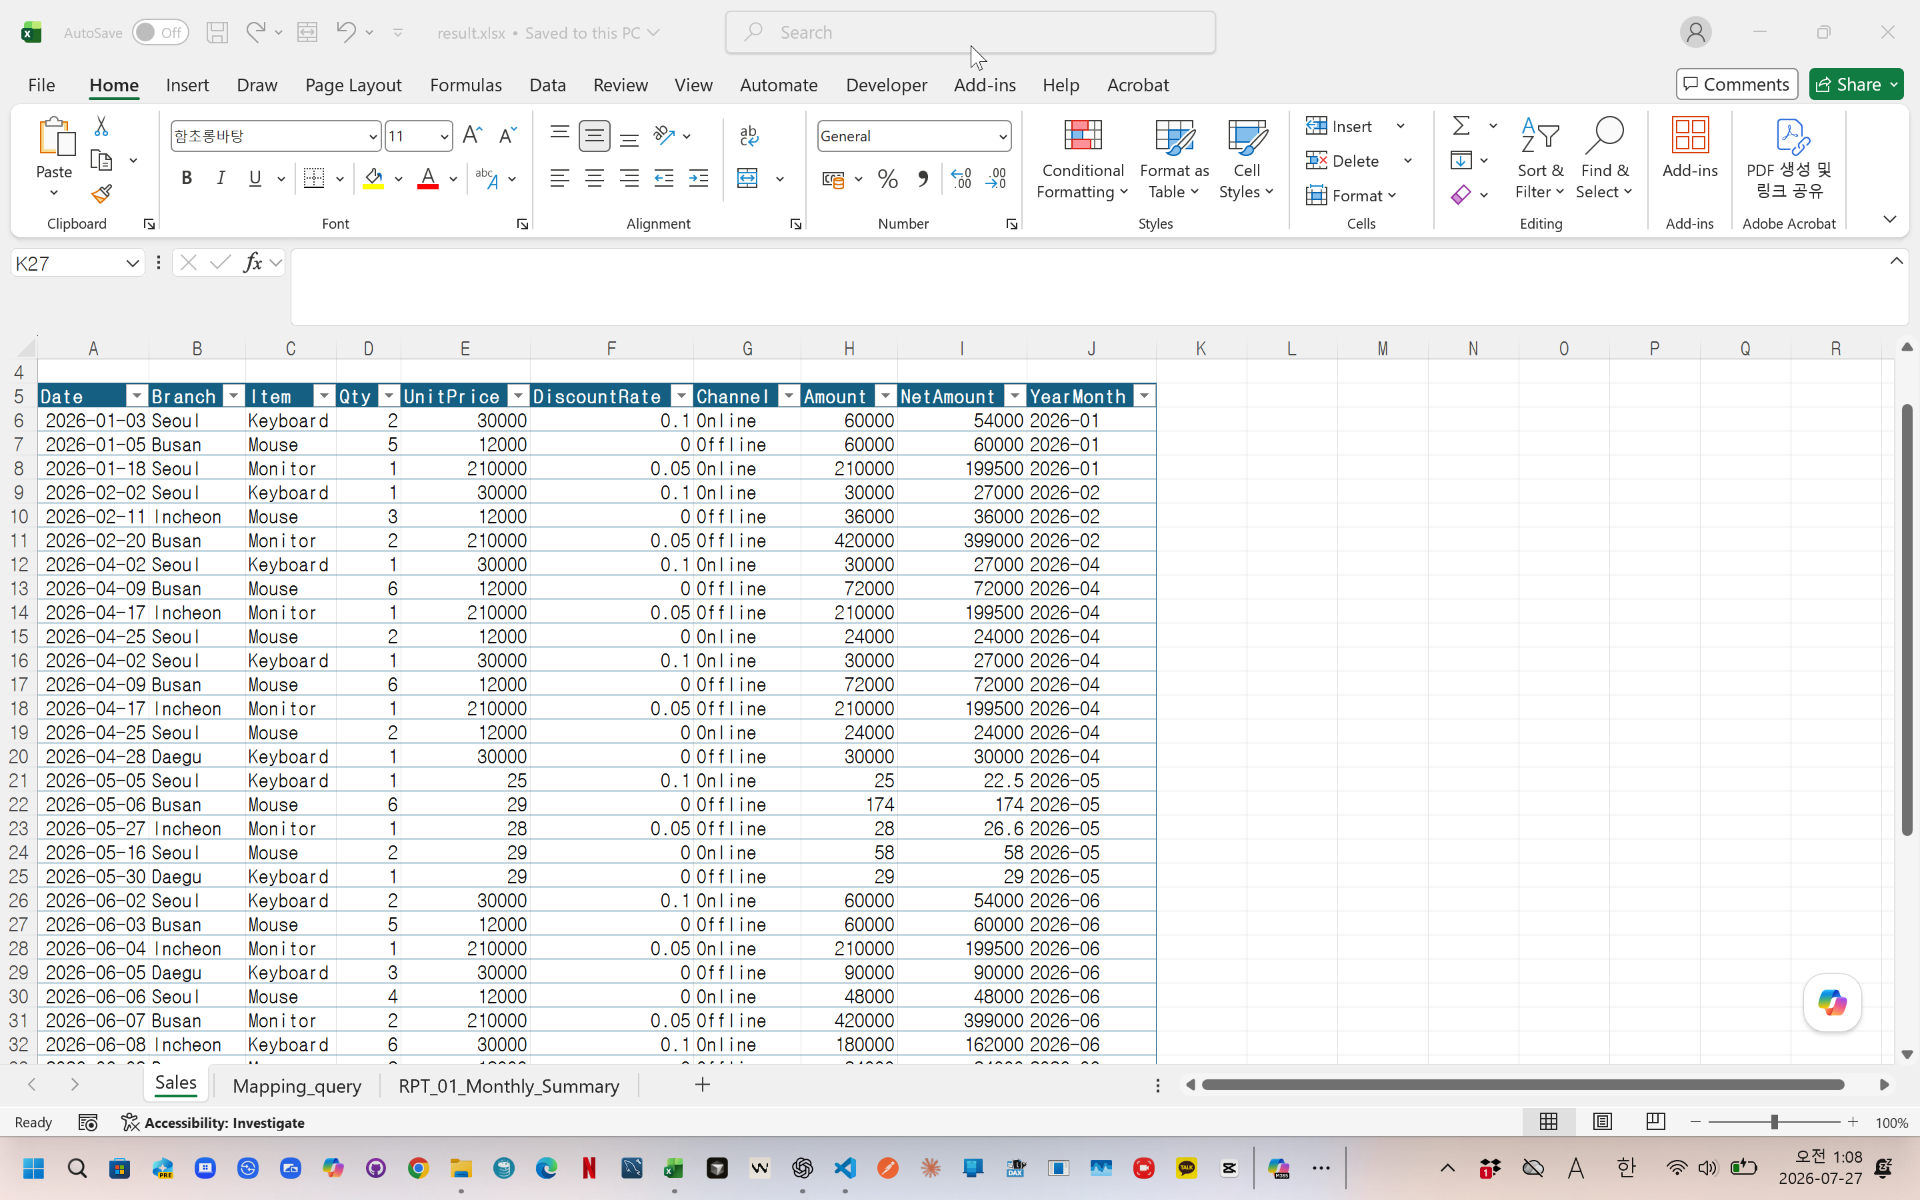
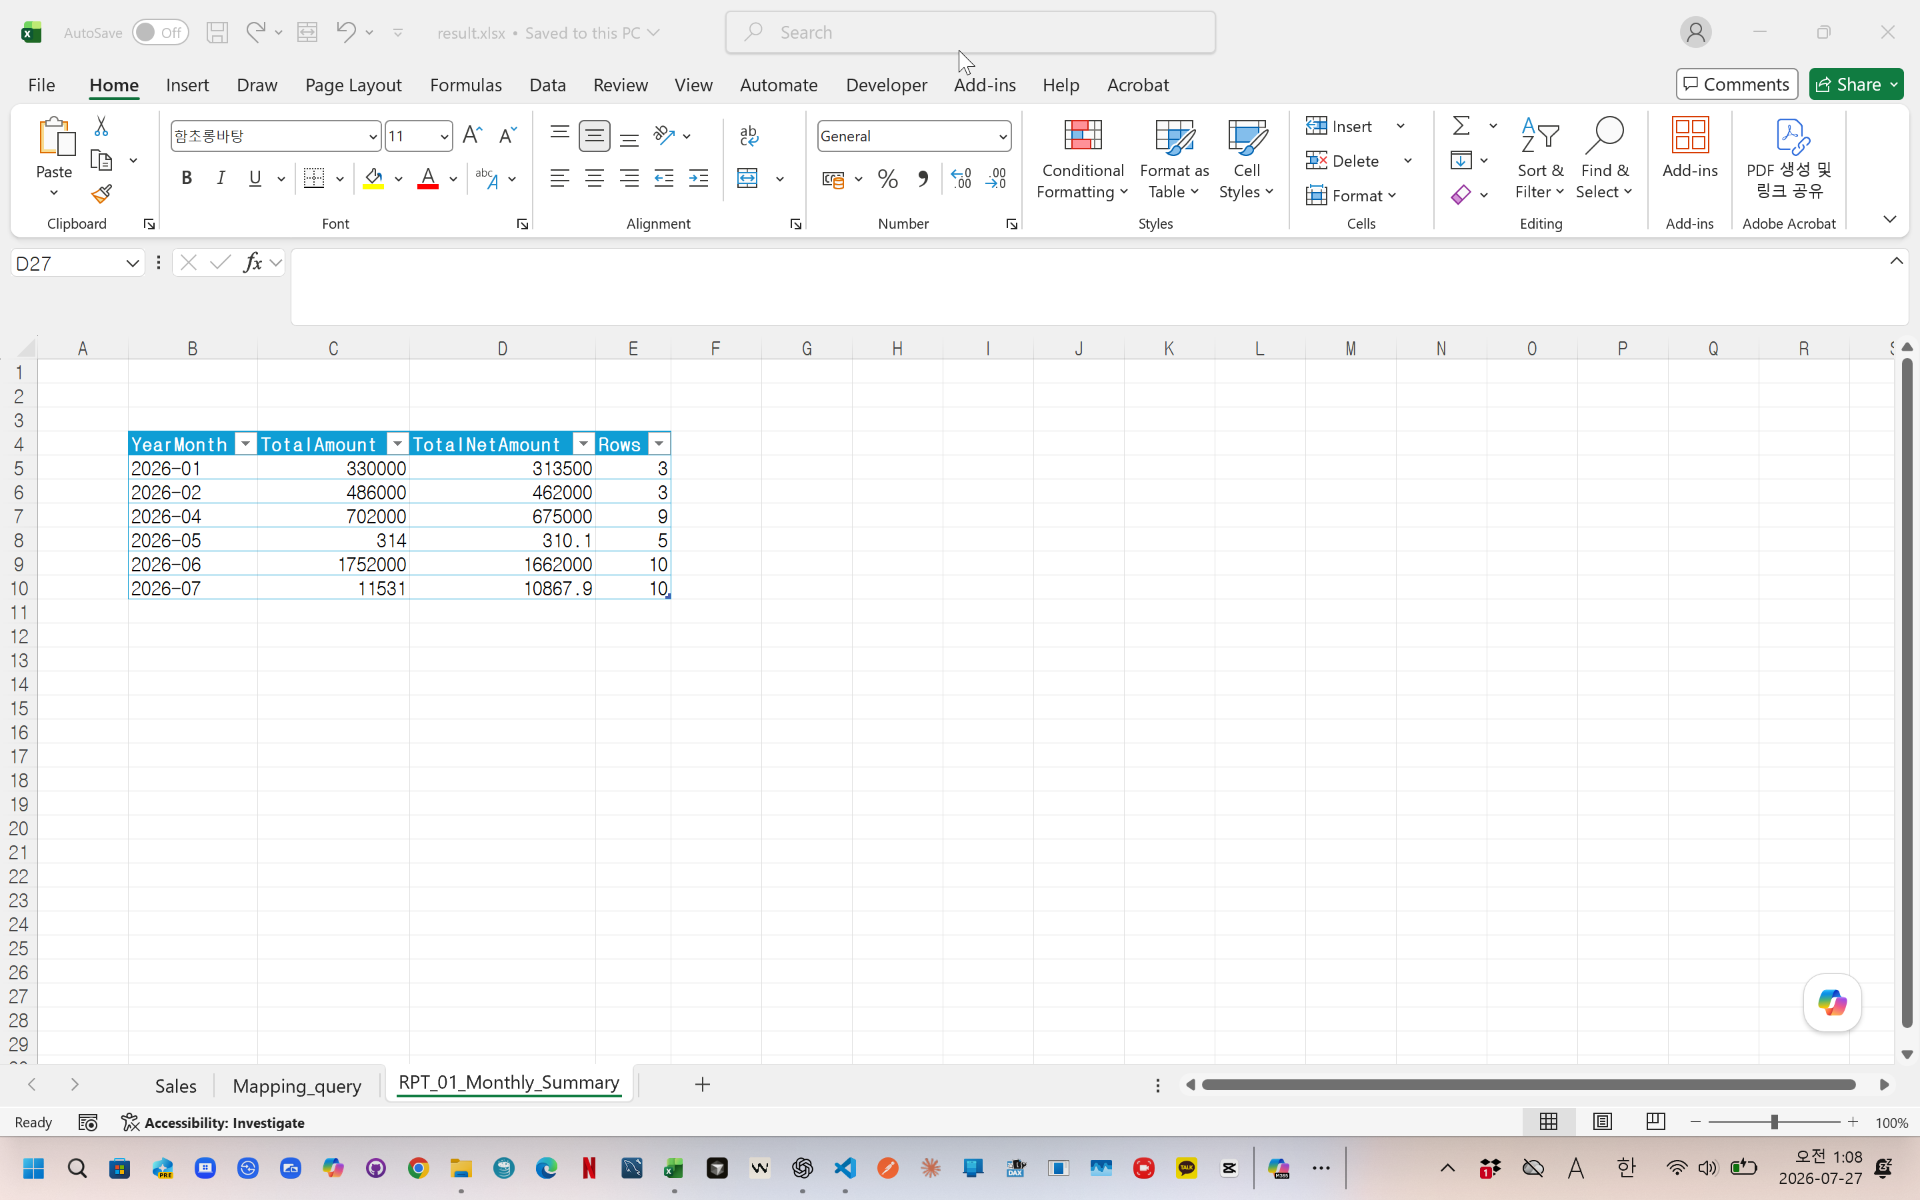
The query references an existing Sales dataset, groups records by YearMonth, calculates total sales, total net sales, and transaction counts, and finally sorts the results in chronological order.
Key Power Query techniques demonstrated in this project include:
• Referencing existing queries
• Table.Group aggregation
• List.Sum calculations
• Row counting
• Monthly sales reporting
• Table.Sort for report ordering
This approach is useful for sales reporting, financial analysis, management dashboards, and automated monthly reporting systems.
videolink - https://youtu.be/mlat-i81Wps
Download the sample file below.
You can download the zip file in [Download] page
The file name is 53.RPT_01_Monthly_Summary.zip
Use the English M code provided for your dataset.
You may need to manipulate the M code under your circumstance. You consider this point and use M code
below txt file is detailed-explanation. You use M code in reference with this explanation.
---------------------------------------------------------
Need a custom automation for your AI workflow?
I can build a tailored solution based on your data.
✔ Used in real-world business automation
✔ Saves hours of manual work
minbedata@gmail.com
You can pay via PayPal.
You don't worry about conversing with me.
My Major is an English literature, so I can speak English fluently and read, listening, writing proficiently
korean version web address (한국버전) is
<a href="https://blog.naver.com/minbe-data" target="_blank">네이버 블로그 바로가기</a>